Quantcast
Channel: Windows Incident Response
Viewing all 505 articles
Browse latest View live

The Death of AV??

$
0
0

I had a conversation recently, which started out being about endpoint technologies.  At one point in the conversation, the topic of AV came up.  The question was, is there still value in AV?

I believe there is; I believe that AV, when managed properly, can be a valuable tool.  However, what I've very often seen, through targeted threat response and DFIR analysis, is that AV isn't maintained or updated, and when it does detect something, that detection is ignored.

MS systems have had the Malicious Software Removal Tool (MSRT) installed for some time.  This is a micro-scanner, designed to target specific instances of malware.  Throughout many of the investigations I've done, I've seen where systems were infected with malware variants that should have been prevented by MSRT; however, in those instances, I've found that MSRT hasn't been kept up to date, and was last updated well prior to the infection.

Not long ago, I was assisting with some analysis work, and found that the customer was using WebRoot as their AV product. I found entries for AV detections in the Registry, and based on the timing, it was clear that while the product had detected and quarantined an instance of Dridex, the customer was still infected with ransomware.  That was due to no one being aware of the detection, and as such, no one took action. The threat actor was able to find something else they could install that wasn't detected by the installed AV product, and proceed with their attack.

Over the years, I've had more than a few opportunities to observe threat actor behavior, through a combination of EDR telemetry and DFIR analysis.  As such, I've seen more than a few methods for circumventing AV, and in particular, Windows Defender.  Windows Defender is actually a pretty decent AV product; I've had my research interrupted, as when I would download a web shell or "malicious" LNK file for testing, and Windows Defender would wake up and quarantine the file.  Very recently, I was conducting some analysis as part of an interview questionnaire, and wrote a Perl script to deobfuscate some code.  I ran the script and redirected the output to a file, and Windows Defender pounced on the resulting file.  Apparently, I did things correctly.

Again, I've seen threat actors disable Windows Defender through a variety of means, from stopping the service, to uninstalling the product.  I've also seen more subtle "tweaks", such as adding path exclusions to the product, or just disabling the AV component via a Registry value. However, the attacks have proceeded, because the infrastructure lacked the necessary visibility to detect these system modifications.  Further, there was no proactive threat hunting activity, not even an automated 'sweep' of the infrastructure, checking against various settings.

So, no...AV isn't dead.  It's simply not being maintained, and no one is listening for alerts.  AV can be very valuable.  Not only can checking AV status be an effective threat hunting tool (in both proactive scanning and DFIR threat hunting), but I've also been using "check AV logs" as part of my malware detection process. This is because AV has always been a great place to look for indications of attacks.


Toolmarks

$
0
0

 I recently ran across an interesting article from Sophos, indicating that the Maze ransomware threat group had taken a page from the Ragnar ransomware threat group.  The article stated that the Maze group was seen delivering the ransomware in a virtualize environment as a means of defense evasion.

In describing the attack, the article includes the following:

...before they launched it, they executed a script that disabled Windows Defender’s Real-Time Monitoring feature.

Immediately following this, the article includes the contents of the batch file that perform this function, and we can see that the command is:

cmd.exe /c powershell.exe -exec Bypass /c Set-MpPreference -DisableRealtimeMonitoring 1

We know the impact of this command; Windows Defender real-time monitoring is disabled, and the Registry value is set to "1".  Also, the key LastWrite time will be updated to when this command was executed.  This is important because these toolmarks are different from other methods used to disable Windows Defender. For example, some threat actors have been observed using 'net stop' commands to stop the service, or using external tools, such as ProcessHacker or Defender Control.  Other actors have been observed enabling the DisableAntiSpyware value, or adding exclusions to the Registry. Some actors use Powershell or WMI, others use reg.exe. Whichever means that is used leaves different toolmarks.

Some folks (i.e., my wife) like analogies, so here's one...you usually access your home by putting a key in the lock, a key you own that is designed to open the door.  However, there are other ways to accomplish the same activity (i.e., opening the door).  You can use lock picks, a crowbar, or a 12 lb sledge. If the door has glass panels, maybe you can break one, reach inside and unlock the door.  However, the point is that all of these methods, while accomplishing the same goal, leave different toolmarks. These toolsmarks can be used to illustrate "humanness" in an attack, can be used to clarify and extend attribution, and can be used in proactive protection measures, such as EDR monitoring, and EDR threat hunting.  They can also be used in DFIR threat hunting, to facilitate the analysis process.

All of this is extremely valuable and can should be exploited to maximize its effect.

As far as the virtual machines go, the toolmarks differed between the Maze and Ragnar threat groups, as well.  The article sums those differences up by stating:

The Maze attackers took a slightly different approach, using a virtual Windows 7 machine instead of XP. This significantly increased the size of the virtual disk, but also adds some new functionality that wasn’t available in the Ragnar Locker version. 

Finally, as I read through the article, it occurred to me that, based on how the article was written, it seemed that the threat group knew something about the infrastructure.  Either the story of the attack was heavily edited, or the threat group had prior knowledge of the infrastructure.  Well, as it turned out:

The virtual machine was, apparently, configured in advance by someone who knew something about the victim’s network...

All of the information in the Sophos articles is extremely valuable, because it not only reinforces Microsoft's perspective on "human-operated ransomware attacks", but also reinforces that they're preventable.

#OSDFCON

$
0
0

 The agenda for the 11th annual Open Source Digital Forensics Conference has been posted.  I've attended OSDFCON before (several times), it's one of the conferences where I've enjoyed presenting over the years. Maybe someone reading this remembers the "mall-wear" incident from a number of years ago.

So, on 18 Nov, I'll be speaking on Effectively Using RRv3This past spring, I shared some information about about this new version of RegRipper (here, and here), as well as highlighting specific plugins. What I'd like to do is, in the same vein as the conference agenda, crowd-source some of the content for my 30 min presentation.

What would you like to see, hear, or learn about during my 30-ish minute presentation regarding RegRipper 3.0?

Settings That Impact The Windows OS

$
0
0

There are a number of settings within Windows systems that can and do significantly impact the functionality of Windows, and as a result, can also impact what is available to a #DFIR analyst.  These settings very often manifest as modifications to Registry keys or values. These settings also make excellent targets for threat hunting, as well.

Application Prefetching
Most DFIR analysts are aware of application prefetching and what it means.  In short, when application prefetching is enabled, files with *.pf extensions are created in the C:\Windows\Prefetch folder.  These files are intended to provide quicker loading of frequently-used applications, by placing needed information in a specific, known location.  

Most analysts are also aware that application prefetching is not enabled by default on server versions of Windows.  As such, Prefetch files are expected on Windows 7 and 10 systems, but not on Windows Server 2016 and 2019 systems.

As Dr. Ali Hadi pointed out, not all application prefetch files appear directly beneath the Prefetch folder.

Plaintext Passwords
We've seen the UseLogonCredential value being used during credential access for some time now, as creating this value and setting it to "1" tells the operating system to maintain credentials in memory in plain text.  As a result, threat actors have been observed creating this value (via reg.exe), setting it to "1", and then returning to the system 6 - 14 days later (depending upon the time frame, campaign, threat actor group, etc.) and using freely available tools such as mimikatz to dump credentials.  In a number of cases, lateral movement has followed very shortly thereafter, as the credentials are available.

If you perform a Google search for the value name, you'll find more than a few articles that mention setting the value to "0" in order to disable the functionality; however, this will have little effect if the threat actor is able to access systems with the appropriate level of privileges to set the value to "1".  However, this does provide an excellent resource for proactive, reactive, and DFIR threat hunting.  This is easy to set up and automate, and you'll only need to react when the value is found, and when it's set to "1".  That is, however, if the value doesn't exist within your infrastructure at all; if it does, and you find it set to "0", you then have good reason to investigate further.

Disabling Security Event Logging
About a year ago, this Sec-Labs blog post described a Registry key that, when added to a system, disabled Security Event Logging.  More recently, this tweet reiterated the same thing, referring to the blog post; I tested this on a Windows Server 2016 VM and found that it worked exactly as described in the Sec-Labs blog post; the EventViewer wasn't functioning properly and after extracting Windows Event Logs from the VM image file, I found the Security Event Log was not being populated.  After adding the value to the Registry, I had rebooted the system several times, which should have caused logon events to be written to the log file; however, upon examination of the Security.evtx file, this was not the case.

This is markedly different from clearing the Security Event Log.  If a Windows Event Log is cleared, some, if not all, of the records may be recovered (I say "may" because it depends upon how soon you're able to respond).  However, adding the "MiniNt" key to the Registry causes events to not be written to the Security Event Log, and as a result, there's nothing to "recover".  Nothing is written, neither to the log nor to unallocated space.

I know...I was thinking the same thing when I read the original blog post on the topic, and thought it again when I saw that it worked.

Conclusion
There are other Registry keys and values that can significantly impact the performance and operation of the Windows operating system; the three listed here are by far not the only ones.  Rather, they are just examples, and serve to demonstrate what I meant by "significantly impact". These keys and values can also be added to a proactive, reactive, or DFIR threat hunting process.

Name Resolution

$
0
0

How often to DFIR analysts think about name resolution, particularly on Windows systems?  I know that looking back across engagements I've done in the past, I've asked for DNS server logs but very often, these were not available. I'm sure others have seen the same thing. When we moved to enterprise response and had access to EDR tools, we could look up DNS queries or create reports based on EDR telemetry, if such a thing was recorded by the agent.  In some cases, we could have the DNS queries automatically checked against a blacklist, and queries for known-bad domains highlighted or marked.

According to MS KB article 172218, Windows systems look to their local hosts file prior to making a DNS query (on the network) when looking up a host name. This hosts file is located, by default, in the %SystemRoot%\System32\drivers\etc folder.  I say "by default", because this path can be changed via the following Registry value:

Key: HKLM\System\CurrentControlSet\Services\Tcpip\Parameters
Value: DataBasePath

Okay...so what?  Well, it's widely known that threat actors will (we know because we've seen it) make modifications to Windows systems to meet their needs, modifying the environment to suit their goals.  We've discussed some of those settings before, and we've seen where threat actors have changed the location of a user's StartUp folder in order to hide their persistence mechanism.  If I wanted to keep DNS queries from appearing on the network, it would be relatively easy to either just modify the hosts file, or change the default location and plant a malicious hosts file.

Addendum, 22 Oct - since publishing this post yesterday, others have tried this and found that changing the location of the hosts file does not appear to work.  At this point, I have only found the value to exist on a few of the Windows 10 1809 and up systems/images to which I have access, and through searches, I've found indications online that this does not work for Windows 7 systems.  At this point, in the absence of explicit documentation, a bit more testing would be valuable.

However, analysts should still keep in the name resolution order in mind, and be aware that modifying the hosts file itself is still something a threat actor can do.  Other issues to keep in mind include the use of persistent routes (I've actually seen this done for legitimate business purposes), as well as the use of a port proxy. Both are fairly trivial to check during DFIR pre-processing or threat hunting.


Happy Birthday, Marine Corps!

$
0
0


I thought today of all days would be a good time to break from tradition and share a post that has nothing to do with DFIR or Windows, one that isn't technical, nor related to computers. 

Some of you may be aware that once, in a galaxy far, far away, I was a Marine officer.  I was commissioned out of college, and served for a total of eight years.  During that time, I attended some interesting birthday ball events.  

There was the year that I was the commander of the cake detail, in charge three other Marines as we escorted the "cake" to the proper location in the ballroom. The guest of honor, and the oldest Marine in the room, was PX Kelley.  The youngest Marine was a 2ndLt on the cake detail.  That's the year that I learned a little secret, that the 'cake' isn't really cake. The vast majority of what looks like a cake is actually plywood decorated with icing.  For the 'cake' we were escorting, the second tier of the 'cake' was ringed with small USMC flags, with a small US flag marking the left and right borders of what was actually cake.

There was the year when, for some reason, the birthday ball venue included a stage, and a ramp was constructed for the cake detail to escort the cake up to the stage for the ceremony.  I'm sure that the detail practiced moving a gurney but apparently they did so without an actual cake, because when the detail got to the top of the ramp during the ceremony, the two lead Marines realized that they needed to actually lift the cake, as there was a lip at the top of the ramp.  When they did so, the gurney beneath the cake was freed, and rolled back down the ramp.  Much hilarity ensued as the two trailing Marines, being downhill, realized that they weren't going to be holding the cake for long.  Fortunately, several Marines in the audience jumped into action and rescued the detail.

There was the year when the commanding general droned on and on, as general officers are want to do. In fact, the general went on for so long that several Marines in the ceremony (who apparently had 'celebrated' prior the ceremony) began passing out.  One of the senior Marines, who was later my boss, passed out...twice.  He was caught the first time, before he completely pitched over, and took a seat for a few minutes at a table.  Then he got up, got back into the formation, went to the position of attention, and apparently locked his knees again, because within seconds he began pitching back and forth.  After the first instance, those of us seating at tables near the ceremony set up "fields of fire" and began watching those in the ceremony closely, looking for eyes rolling back, knees buckling, etc.

However, the most memorable birthday ball occurred in Nov, 1990, as units that had participated in Operation Valiant Blitz returned to Okinawa from Pohang, South Korea.  I was temporarily assigned to the USS Duluth as the billeting officer, and was responsible for the billeting of 217 Marines, as well as several officers and staff NCOs.  On 10 Nov 1990, at 23:45, the ship's platoon assembled in the mess for mid-rats and the birthday celebration. The Navy cooks had made a big sheet cake, that apparently had been subject to the rolling of the ocean; one end of the cake had about an inch of cake, and an inch of icing, while the other end had two inches of cake and just the slightest layer of icing.  For most of the young Marines on board, I don't think it mattered...and I hope that the those 18- and 19-year-olds who were there realized that they were part of a tradition reaching back more than 200 years.

So, to all past, present, and future Marines...Happy Birthday!

Speaking at Conferences, 2020 edition

$
0
0

As you can imagine, 2020 has been a very "different" year, for a lot of reasons, and impacts of the events of the year have extended far and wide.  One of the impacts is conference attendance, and to address this, several conferences have opted to go fully virtual. 

The Open Source Digital Forensics Conference (OSDFCon) is one such conference.  You can watch this year's conference via YouTube, or view the agenda with presentation PDFsBrian and his team (and his hair!) at BasisTech did a fantastic job of pulling together speakers and setting up the infrastructure to hold this conference completely online this year.

Speakers submitted pre-recorded presentations, and then during the time of their presentation, accessed the Discord channel set up for their talk in order to answer questions and generally interact with those viewing the presentation.

I've attended (in person) and spoken at this conference in the past, and I've thoroughly enjoyed the mix of presentations and attendees. This time around, presenting was very different, particularly given that I wasn't doing so in a room filled with people.  I tend to prefer speaking and engaging in person, as well as observing micro-expressions and using those to draw people out, as more often than not, what they're afraid to say or ask is, in reality, extremely impactful and insightful.  

In many ways, an online virtual conference is no different from an in-person event.  In both cases, you're going to have your vocal folks who overwhelm others.  A good example of this was the Discord channel for my talk; even before I logged in for the presentation, someone had already posted a comment about textbooks for DFIR courses.  I have to wonder, much like an "IRL" conference, how many folks were in the channel but were afraid to make a statement or ask a question.

Overall, I do think that the pandemic will have impacts that extend far beyond the wide-spread distribution of a vaccine.  One thought is that this is an interesting opportunity for those doing event planning to re-invent what they do, if not their industry.  Even after we move back to in-person meetings and conferences, there will still be significant value in holding virtual or hybrid events, and planning for such an event to be seamless and easy to access for the target audience will likely become an industry unto itself.

Addendum, 24 Nov: Here is the link to the video for my presentation.

Other videos:
Video for Brian's RDPiece presentation 
Asif's Investigating WSL presentation
Linux Forensics for IoT

Extracting Toolmarks from Open Source Intel

$
0
0

I've talked about toolmarks before...what they are, why (I believe) they're important, that sort of thing.  I've also described how I've implemented them, and about toolmarks specific to different artifacts, such as LNK files. The primary source for toolmarks should be the investigations you're performing; when you do data collection pursuant to an investigation, those toolmarks that you develop should be baked back into your analysis process.  For #DFIR consulting businesses, this is a truly powerful use of the petabytes of data flowing through your organization on a monthly basis, driving toward increasingly efficient analysis and reducing the engagement/SOW lifecycle.

While your own investigations should be the primary source of toolmarks, you can also take advantage of open source reporting to extend this capability. In some cases, open source reports are full of unrealized toolmarks, which any organization can leverage to extend their detection and threat hunting (including #DFIR threat hunting) capabilities. 

I know what you're thinking...how would you go about doing that?  How do you turn open source reporting into something actionable, leveraging toolmarks to extend your organization's capabilities?  Well, let's take a look...

Recently, Microsoft published a security blog regarding the 2nd stage activation from SunBurst, and based on the information they provided in the article, I thought that this would be a good opportunity to illustrate how to extract or realize toolmarks from open source reporting. The Microsoft article is a great example, because it is chock full of intrusion intel that leads directly to toolmarks.

For example, consider fig. 3 in the article; step 3 shows an "Image File Execution Options" Debugger value being set for the dllhost.exe executable.  The toolmark here is obvious; a new subkey is created, and a new value is added to that subkey. In step 6 we see that the Debugger value is deleted; at this point, the question is, is the dllhost.exe subkey left in place?  If so, the LastWrite time of the key would correspond to when the Debugger value was deleted; if not, and the dllhost.exe subkey is also deleted, then the residual toolmark becomes the LastWrite time of the "Image File Execution Options" key.  As a result, if the time stamp toolmark in question falls within the window of other interesting activity, then you likely have an actionable toolmark associated with this activity.

Make sense?

A couple of paragraphs below the figure, we see the following statement:

Finally, the VBScript removes the previously created IFEO value to clean up any traces of execution (step #6) and also deletes the following registry keys related to HTTP proxy:

Nomenclature alert...the two subsequent paths listed are actually to Registry values, not keys. As a result, in this case, the LastWrite time of the "Internet Settings" key would correspond closely to the above toolmark (i.e., IFEO key LastWrite time).  These two time stamps are very specific set of toolmarks related to this specific activity.

Now, let's mosy on down to the section of the article that mentions "anti-forensic behavior" because, well, this is the fun stuff.  The second bullet in that section includes the statement, "...WMI persistence filters were created..."; basically what this tells us is, be sure you're parsing the OBJECTS.DATA file!  So, different data source (i.e., not the Registry in this case), but a definite toolmark.

The third bullet in the "anti-forensic" section states, "...the attackers took care of disabling event logging using AUDITPOL and re-enabling it afterward."  Oh, now THIS is cool! We see in the table following this section that the command used is:

auditpol /set /category:”Detailed Tracking” /success:disable /failure:disable

This command modifies the "Default" value beneath the Policy\PolAdEvt key in the Security hive, which in turn causes the LastWrite time of the key to be updated.  The article then states that when the threat actor completes their activity, they set "success" and "failure" to "enable"; at this point, the toolmark is the LastWrite time of the key, and the value settings themselves.

Next, when the threat actor modifies the Windows firewall by adding a rule via netsh.exe, the action results in a modification to the Windows Registry, as does the use of sc.exe and reg.exe to disable Windows services remotely and locally, respectively, and the use of net.exe to map a OneDrive share. All of these actions result in a modification to the system that is evident tithin the Windows Registry, and all you need to do is pull them out in a timeline to see how close they are, temporally.

Another example of extracting toolmarks from open source reporting can be found in this article that describes how to use the finger.exe client to transfer files between systems. The article describes the use of netsh.exe to set up a port proxy in order to get port 79 TCP traffic out of the network.  The command used is similar to the one described in this Mandiant article on RDP tunneling, which results in a modification to the HKLM\System\CurrentControlSet\services\PortProxy\v4tov4\tcp key, adding a value. When the port proxy configuration is removed, the action can be indicated by the LastWrite time of the tcp key being updated.

An important aspect to keep in mind is detection and response time with respect to the toolmarks being created.  What I mean by that is that if response occurs relatively close to the action occurring (i.e., a Registry key and/or value being added), then the modification may exist in the transaction log, and may yet to be written to the hive.  This is also true with respect to the deletion.  Also, if the key LastWrite times correspond to the window of suspicious activity, but the keys/values do not exist, be sure to parse unallocated space within the hive file to determine if the deleted nodes can still be found and extracted.

While your own investigations should continue to be the primary source of actionable toolmarks that you apply back to or bake back into your analysis process, incorporating toolmarks developed and leveraged from open source reporting can significantly extend your reach and capabilities. 


Extracting Toolmarks from Open Source Reporting, pt II

$
0
0

On the heels of my previous post on this subject, I ran across this little gem from Microsoft regarding the print spooler EOP exploitation. I like articles like this because they illustrate threat actor activities outside the "norm", or what we usually tend to see in open reporting, if such things are illustrated in detail.

Fig 4 (in step 1) in the article illustrates a new printer port being added to a Windows system as a step toward privilege escalation. This serves as one of the more-than-a-few interesting EDR-style tidbits from the article (i.e., detect the Powershell commandline), and also results in a fantastic toolmark that can be applied to DFIR "threat hunting". 

The article illustrates, via fig 4, Powershell being used to add a printer port to the system, and that command results in a value being added to the Registry. There are other ways to go about this, of course, and this is only one example of how to achieve adding a printer port to a Windows system.  For example, you can use "win32_tcpipPrinterPort" via WMI to add a TCP printer port.

Whichever means is used, the end result is a value being added to the Registry, which means if there is no EDR capability on the system at the time that the port is created, we can still determine if a port was, in fact, created. This would be reflected in a new value being added to the Registry key, and the key LastWrite time being updated accordingly. The RegRipper ports.pl plugin will extract this information, and creating a timeline that includes Registry key LastWrite times will likely show the Registry key modification within the timeline.

Other RegRipper plugins that address toolmarks from open reporting associated with printers on Windows include:

printer_settings.pl - retrieves printer attributes, looking for indications that printers were set to not delete print jobs after they were spooled and sent to the printer (per Project TajMahal open reporting), enabling local data staging. 

printprocessors.pl - this open reporting on Winnti indicates that print processors have been used for persistence.

The purpose of this blog post (as well as the previous one) has been to illustrate a means by which open reporting can be incorporated into any analyst's process. In this example, I've shared the names of RegRipper plugins I've created, so that the toolmarks, along with the appropriate MITRE ATT&CK mappings and analysis tips, are always available to me during my analysis. As I've included the online resources in the headers of the plugins, I have those resources available should I need to refer to them. Overall, this adds breadth, depth, and most importantly, consistency to my analysis process, letting me get to the actual analysis much sooner. From this point, I can then curate any new findings or lessons learned based on that analysis, and bake that back into my process, extending that capability yet again.

There are, of course, other means to go about baking new findings and lessons learned back into your analysis process.  However, it depends largely upon what you're able to ingest or incorporate.  For example, if you're doing malware analysis or any sort of log analysis, Yara rules might provide a good option for you. The Nuix Investigate product includes extensions for both RegRipper and Yara rules, extending the capabilities of the product.

Yet another means is to use something like wevtx.bat, which uses eventmap.txt to provide a small modicum of enrichment to specific Windows Event Log records as they're added to a timeline.

These are all very basic means for extending your current analysis process with new toolmarks from open reporting, as well as baking new findings and lessons learned back into the process.

On #DFIR Analysis

$
0
0

I wanted to take the opportunity to discuss DFIR analysis; when discussing #DFIR analysis, we have to ask the question, "what _is_ "analysis"?"

In most cases, what we call analysis is really just parsing some data source (or sources) and either viewing the output of the tools, or running keyword searches.  When this is the entire process, it is not analysis...it's running keyword searches. Don't get me wrong, there is nothing wrong with keyword searches, as they're a great way to orient yourself to the data and provide pivot points into further analysis.  However, these searches should not be considered the end of your analysis; rather, they are simply be beginning, or at least early stages of the analysis. The issue is that parsing data sources in isolation from each other and just running keyword searches in an attempt to conduct "analysis" is insufficient for the task, simply due to the fact that the results are missing context.

We "do analysis" when we take in data sources, perhaps apply some parsing, and then apply our knowledge and experience to those data sources.  This is pretty much how it's worked since I got started in the field over 20 yrs ago, and I'll admit, I was just following what I had seen being done before me.  Very often, this "apply our knowledge and experience" process has been abstracted through a commonly used commercial forensic analysis tool or framework (i.e., EnCase, X-Ways, FTK, Autopsy, to name a few...). 

The process of collecting data from systems has been addressed by many at this point. There are a number of both free and commercially available tools for collecting information from systems. As such, all analysts need to do at this point is keep up with changes and updates to the target operating systems and applications, and ensure the appropriate sources are included in their collections.

Over time, some have worked to make the parsing and analysis process more efficient, by automating various aspects of the process, by either setting up processes via the commercial tools, or by using some external means.  For example, looking way back in the mists of time when Chris "CPBeefcake" Pogue and I were working PCI engagements as part of the IBM ISS ERS team, we worked to automate (as much as possible) the various searches (hashes, files names, path names) required by Visa (at the time) so that they were done in as complete, accurate, and consistent manner as possible. Further, tools such as plaso, RegRipper, and others provide a great deal of (albeit incomplete) parsing capability. This is not simply restricted to freely available tools; back when I was using commercial tool suites, I extended my use of ProDiscover, while I watched others simply use other commercial tools as they were "out of the box".

A great example of extending something already available in order to meet your needs can be found in this FireEye blog post, where the authors state:

We adapted the...parsing code to make it more robust and support all features necessary for parsing QMGR databases.

Overall, a broad, common issue with both collection and parsing tools is not with the tools themselves, but how they're viewed and used.  Analysts using such tools very often do little really identify their own needs, and then to update or extend those tools, looking at their interaction with the tools as the end of their involvement in the process, rather than the beginning.

So, while this automates some tasks, the actual analysis is still left to the experience and knowledge of the individual analyst, and for the most part, does not extend much beyond that. This includes not only what data sources and artifacts to look to, but also the context and meaning of those (and other) data sources and artifacts. However, as Jim Mattis stated in his book, "Call Sign Chaos", "...your personal experiences alone are not broad enough to sustain you." While this statement was made specifically within the context of a warfighter, the same thing is true for DFIR analysts. So, the question becomes, how can we implement something like this in DFIR, how do we broaden the scope of our own personal experiences, and build up the knowledge and experience of all analysts, across the board, in a consistent manner?

The answer is that, much like McChrystal's "Team of Teams", we need a new model.
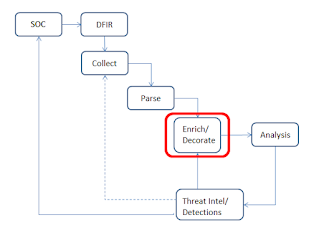
Fig 1: Process Schematic
A New DFIR Model

Back in the day...I love saying that, because I'm at the point in my career where I can..."DFIR" meant getting a call and going on-site to collect data, be it images, logs, triage data, etc. 

As larger, more extensive incidents were recognized and became more commonplace, there was a shift in the industry to where some DFIR consulting firms were providing EDR tools to the customer to install, the telemetry for which reported back to a SOC. Initial triage and scoping could occur either prior to an analyst arriving on-site, or the entire engagement could be run, from a technical perspective, remotely.  

Whether the engagement starts with a SOC alert, or with a customer calling for DFIR support and EDR being pushed out, at some point, data will need to be collected from a subset of systems for more extensive analysis. EDR telemetry alone does not provide all the visibility we need to respond to incidents, and as such, collecting triage data is a very valuable part of the overall process.  Data is collected, parsed, and then "analyzed". For the most part, there's been a great deal of work in this area, including here, and here. The point is that there have been more than a few variations of tools to collect triage data from live Windows systems.

Where the DFIR industry, in the general sense, falls short in this process (see fig 1) is right around the "analysis" phase. This is due to the fact that, again, "analysis" consists of each analyst applying the sum total of their own knowledge and experience to the data sources (triage data collected from systems, log data, EDR telemetry, etc.). 

Why does it "fall short"?  Well, I'll be the first to tell you, I don't know everything. I've seen a lot of ransomware and targeted ("nation state", "cybercrime") threat actors during my time, but I haven't seen all of them.  Nor have I ever done a BEC engagement. Ever. I haven't avoided them or turned them down, I've just never encountered one. This means that the analysis phase of the process is where things fall short. 

So how do we fix that?  One way is that if I take everything I learn...new findings, lessons learned, anything I find via open sources...and "bake it back into" the overall process via a feedback loop.  Now, this is something that I've done partially through several tools that I use regularly, including RegRipper, eventmap.txt, etc. This way, I don't have to rely on my fallible memory; instead, I add this new information to the automated process, so that when I parse data sources, I also "enrich" and "decorate" appropriate fields.  I'm already automating the parsing so that I don't miss something important, and now, I can increase visibility and context by automating the enrichment and decoration phase.

Now, imagine how powerful this would be if we took several steps.  First, we make this available to all analysts on the team. What one analyst learns instantly becomes available to all analysts, as the experience and knowledge of one is shared with many. Steve learns something new, and it's immediately available to David, Emily, Margo, and all of the other analysts. You do not have to wait until Steve works directly with Emily on an engagement, and you do not have to hope that the subject comes up. The great thing is that if you make this part of the DFIR culture, it works even if Steve goes on paternity leave or a family vacation, and it persists beyond any one analyst leaving the organization entirely.

Second, we further extend our enrichment and decoration capability by incorporating threat intelligence. If we do so initially using open reporting, we can greatly extend that open reporting by providing actual intrusion intelligence. We can use open reporting to take what others see on engagements that we have yet to experience, and use that to extend our own experience. Further, the threat intelligence produced (if that's something you're doing) now incorporates actual intrusion intel, which is tied directly to on-system artifacts. For example, while open reporting may state that a particular threat actor group "disables Windows Defender", intrusion intel from those incidents will tell us how they do so, and when during the attack cycle they take these actions. This can provide insight into better tooling and visibility, earlier detection of threat actors, and a much more granular picture of what occurred on the system.

Third, because this is all tied to the SOC, we can further extend our capabilities by baking new DFIR findings back into the SOC in the form of detections. This feedback loop leads to higher fidelity detections that provide greater context to the SOC alerts themselves. A great example of this feedback process can be seen here; while this blog post just passed it's 5th birthday, all that means is that the process worked then and is still equally, if not more, valid today. The use of WMI persistence led directly to the creation of new high-fidelity SOC EDR detections, which provided significantly greater efficacy and context.

While everyone else is talking about 'big data', or the 'lack of cybersecurity skills', there is a simple approach to addressing those issues, and more...all we need to do is change the business model used to drive DFIR, and change the DFIR culture. 

LNK Files, Again

$
0
0

 I ran across SharpWebServer via Twitter recently...the first line of the readme.md file states, "A Red Team oriented simple HTTP & WebDAV server written in C# with functionality to capture Net-NTLM hashes." I thought this was fascinating because it ties directly to a technique MITRE refers to as "Forced Authentication".  What this means is that a threat actor can (and has...we'll get to that shortly) modify Windows shortcut/LNK files such that the iconfilename field points to an external resource. What happens is that when LNK file is launched, Explorer will reach out to the external resource and attempt to authenticate, sending NTLM hashes across the wire.  As such, SharpWebServer is built to capture those hashes.

What this means is that a threat actor can gain access to an infrastructure, and as has been observed, use various means to maintain persistence...drop backdoors or RATs, create accounts on Internet-facing systems, etc.  However, many (albeit not all) of these means of persistence can be overcome via the judicious use of AV, EDR monitoring, and a universal password change.

Modifying the iconfilename field of an LNK file is a means of persisting beyond password changes, because even after passwords are change, the updated hashes will be sent across the wire.

Now, I did say earlier that this has been used before, and it has.  CISA Alert TA18-074A includes a section named "Persistence through LNK file manipulation". 

Note that from the alert, when looking at the "Contents of enu.cmd", "Persistence through LNK file manipulation", and "Registry Modification" sections, we can see a pretty comprehensive set of toolmarks associated with this threat actor.  This is excellent intrusion intelligence, and should be incorporated into any and all #DFIR parsing, enrichment and decoration, as well as threat hunting.

However, things are even better! This tweet from bohops illustrates how to apply this technique to MSWord docs.

On #DFIR Analysis, pt II - Describing Artifact Constellations

$
0
0

 I've been putting some serious thought into the topic of a new #DFIR model, and in an effort to extend and expand upon my previous post a bit, I wanted to take the opportunity to document and share some of my latest thoughts.

I've discussed toolmarks and artifact constellations previously in this blog, and how they apply to attribution. In discussing a new #DFIR model, the question that arises is, how do we describe an artifact or toolmark constellation in a structured manner, so that it can be communicated and shared?  

Of course, the next step after that, once we have a structured format for describing these constellations, is automating the sharing and "machine ingestion" of these constellation descriptions. But before we get ahead of ourselves, let's discuss a possible structure a bit more. 

The New #DFIR Model

First off, to orient ourselves, figure 1 illustrates the proposed "new" #DFIR model from my previous blog post. We still have the collect, parse, and enrich/decorate phases prior to the output and data going to the analyst, but in this case, I've highlighted the "enrich/decorate" phase with a red outline, as that is where the artifact constellations would be identified.

Fig 1: New DFIR Model 
We can assume that we would start off by applying some known constellation descriptions to the parsed data during the "enrich/decorate" phase, so the process of identifying a toolmark constellation should also include some means of pulling information from the constellation, as well as "marking" or "tagging" the constellation in some manner, or facilitating some other means of notifying the analyst. From there, the expectation would be that new constellations would be defined and described through analysis, as well as through open sources, and applied to the process.

We're going to start "small" in this case, so that we can build on the structure later. What I mean by that is that we're going to start with just DFIR data; that is, data collected as either a full disk acquisition, or as part of triage response to an identified incident. We're going to start here because the data is fairly consistent across Windows systems at this point, and we can add EDR telemetry and input from a SIEM framework at a later date. So, just for the sake of  this discussion, we're going to start with DFIR data.

Describing Artifact Constellations

Let's start by looking a common artifact constellation, one for disabling Windows Defender. We know that there are a number of different ways to go about disabling Windows Defender, and that regardless of the size and composition of the artifact constellation they all result in the same MITRE ATT&CK sub-technique. One way to go about disabling Windows Defender is through the use of Defender Control, a GUI-based tool. As this is a GUI-based tool, the threat actor would need to have shell-based access to the system, such through a local or remote (Terminal Services/RDP) login. Beyond that point, the artifact constellation would look like:
  • UserAssist entry in the NTUSER.DAT indicating Defender Control was launched
  • Prefetch file created for Defender Control (file system/MFT; not for Windows server systems)
  • Registry values added/modified in the Software hive
  • "Microsoft-Windows-Windows Defender%4Operational.evtx" event records generated
Again, this constellation is based solely on DFIR or triage data collected from an endpoint. Notice that I point out that one artifact in the constellation (i.e., the Prefetch file) would not be available on Windows server systems. This tells us that when working with artifact constellations, we need to keep in mind that not all of the artifacts may be available, for a variety of reasons (i.e., version of Windows, system configuration, installed applications, passage of time, etc.). Other artifacts that may be available but are also heavily dependent upon the configuration of the endpoint itself include (but are not limited to) a Security-Auditing/4688 event in the Security Event Log pertaining to Defender Control, indicating the launch of the application, or possibly a Sysmon/1 event pertaining to Defender Control, again indicating the launch of the application. Again, the availability of these artifacts depends upon the specific nature and configuration of the endpoint system.

Another means to achieve the same end, albeit without requiring shell-based access, is with a batch file that modifies the specific Registry values (Defender Control modifies two Registry values) via the native LOLBIN, reg.exe. In this case, the artifact constellation would not need to (although it may be) be preceded by a Security-Auditing/4624 (login) event of either type 2 (console) or type 10 (remote). Further, there would be no expectation of a UserAssist entry (no GUI tool needs to be launched), and the Prefetch file creation/modification would be for reg.exe, rather than Defender Control.  However, the remaining two artifacts in the constellation would likely remain the same.

Fig 2: WinDefend Exclusions
Of course, yet another means for "disabling Windows Defender" could be as simple as adding an exclusion to the tool, in any one or more of the five subkeys illustrated in figure 2. For example, we've seen threat actors create exceptions for any file ending in ".exe", found in specific paths, or any process such as Powershell.

The point is that while there are different ways to achieve the same end, each method has its own unique toolmark constellation, and the constellations could then be used to apply attribution.  For example, the first method for disabling Windows Defender described above was observed being used by the Snatch ransomware threat actors during several attacks in May/June 2020. Something like this would not be exclusive, of course, as a toolmark constellation could be applied to more than one threat actor or group. After all, most of what we refer to as "threat actor groups" are simply how we cluster IOCs and TTPs, and a toolmark constellation is a cluster of artifacts associated with the conduct of particular activity. However, these constellations can be applied to attribution.

A Notional Description Structure

At this point, a couple of thoughts or ideas jump out at me.  First, the individual artifacts within the constellation can be listed in a fashion similar to what's seen in Yara rules, with similar "strings" based upon the source. Remember, by the time we're to the "enrich/decorate" phase, we've already normalized the disparate data sources into a common structure, perhaps something similar to the five-field TLN format used in (my) timelines. The time field of the structure would allow us to identify artifacts within a specified temporal proximity, and each description field would need to be treated or handled (that is, itself parsed) differently based upon the source field. The source field from the normalized structure could be used in a similar manner as the various 'string' identifiers in Yara (i.e., 'ascii', 'nocase', 'wide', etc.) in that they would identify the specific means by which the description field should be addressed. 

Some elements of the artifact constellation may not be required, and this could easily be addressed through something similar to Yara 'conditions', in that the various artifacts could be grouped with parens, as well as 'and' and 'or', identifying those artifacts that may not be required for the constellation to be effective, although not complete. From the above examples, the Registry values being modified would be "required", as without them, Windows Defender would not be disabled. However, a Prefetch file would not be "required", particularly when the platform being analyzed is a Windows server. This could be addressed through the "condition" statement used in Yara rules, and a desirable side effect of having a "scoring value" would be that an identified constellation would then have something akin to a "confidence rating", similar to what is seen on sites such as VirusTotal (i.e., "this sample was identified as malicious by 32/69 AV engines"). For example, from the above bulleted artifacts that make up the illustrated constellation, the following values might be applied:

  • Required - +1
  • Not required - +1, if present
  • +1 for each of the values, depending upon the value data
  • +1 for each event record
If all elements of the constellation are found within a defined temporal proximity, then the "confidence rating" would be 6/6. All of this could be handled automatically by the scanning engine itself.

A notional example constellation description based on something similar to Yara might then look something like the following:

strings:

    $str1 = UserAssist entry for Defender Control
    $str2 = Prefetch file for Defender Control
    $str3 = Windows Defender DisableAntiSpyware value = 1
    $str4 = Windows Defender event ID 5010 generated
    $str5 = Windows Defender DisableRealtimeMonitoring value = 1
    $str6 = Windows Defender event ID 5001 generated

condition:

    $str1 or $str2 and ($str3 and $str4 and $str5 and $str6);

Again, temporal proximity/dispersion would need to be addressed (most likely within the scanning engine itself), either with an automatic 'value' set, or by providing a user-defined value within the rule metadata. Additionally, the order of the individual artifacts would be important, as well. You wouldn't want to run this rule and in the output find that $str1 was found 8 days after the conditions for $str3 and $str5 being met. Given that the five-field TLN format includes a time stamp as its first field, it would be pretty trivial to compute a temporal "Hamming distance", of sorts, a well as ensure proper sequencing of the artifacts or toolmarks themselves.  That is to say that $str1 should appear prior to $str3, rather than after it, but not so far so as to be unreasonable and create a false positive detection.

Finally, similar to Yara rules, the rule name would be identified in the output, along with a "confidence rating" of 6/6 for a Windows 10 system (assuming all artifacts in the cluster were available), or 5/6 for Windows Server 2019.

Counter-Forensics

Something else that we need to account for when addressing artifact constellations is counter-forensics, even that which is unintentional, such as the passage of time. Specifically, how do we deal with identifying artifact constellations when artifacts have been removed, such as application prefetching being disabled on Windows 10 (which itself may be part of a different artifact constellation), or files being deleted, or something like CCleaner being run?

Maybe a better question is, do we even need to address this circumstance? After all, the intention here is not to address every possible eventuality or possible circumstance, and we can create artifact constellations for various Windows functionality being disabled (or enabled).

On #DFIR Analysis, pt III - Benefits of a Structured Model

$
0
0

 In my previous post, I presented some of the basic design elements for a structured approach to describing artifact constellations, and leveraging them to further DFIR analysis. As much of this is new, I'm sure that this all sounds like a lot of work, and if you've read the other posts on this topic, you're probably wondering about the benefits to all this work. In this post, I'll take shot at netting out some of the more obvious benefits.

Maintaining Corporate Knowledge

Regardless of whether you're talking about an internal corporate position or a consulting role, analysts are going to see and learn new things based on their analysis. You're going to see new applications or techniques used, and perhaps even see the same threat actor making small changes to their TTPs due to some "stimulus". You may find new artifacts based on the configuration of the system, or what applications are installed. A number of years ago, a co-worker was investigating a system that happened to have LANDesk installed, along with the software monitoring module. They'd found that the LANDesk module maintains a listing of executables run, including the first run time, the last run time, and the user account responsible for the last execution, all of which mapped very well in to a timeline of system activity, making the resulting timeline much richer in context.

When something like this is found, how is that corporate knowledge currently maintained? In this case, the analyst wrote a RegRipper plugin, that still exists and is in use today. But how are organizations (both internal and consulting teams) maintaining a record of artifacts and constellations that analysts discover?

Maybe a better question is, are organizations doing this at all?  

For many organizations with a SOC capability, detections are written, often based on open reporting, and then tested and put into production. From there, those detections may be tuned; for internal teams, the tuning would be based on one infrastructure, but for MSS or consulting orgs, the tuning would be based on multiple (and likely an increasing number of) infrastructures. Those detections and their tuning are based on the data source (i.e., SIEM, EDR, or a combination), and serve to preserve corporate knowledge. The same approach can/should be taken with DFIR work, as well.

Consistency

One of the challenges inherent to large corporate teams, and perhaps more so to consulting teams, is that analysts all have their own way of doing things. I've mentioned previously that analysis is nothing more that an individual applying the breadth of their knowledge and experience to a data source. Very often, analysts will receive data for a case, and approach that data initially based on their own knowledge and experience. Given that each analyst has their own individual approach, the initial parsing of collected data can be a highly inefficient endeavor when viewed across the entire team. And because the approach is often based solely on the analyst's own individual experience, items of importance can be missed. 

What if each analyst were instead able to approach the data sources based not just on their own knowledge and experience, but the collective experience of the team, regardless of the "state" (i.e., on vacation/PTO, left the organization, working their own case, etc.) of the other analysts? What if we were to use a parsing process that was not based on the knowledge, experience and skill of one analyst but instead on that of all analysts, as well as perhaps some developers? That process would normalize all available data sources, regardless of the knowledge and experience of an individual analyst, and the enrichment and decoration phase would also be independent of the knowledge and skill of a single analyst.

Now, something like this does not obviate the need for analysts to be able to conduct their own analysis, in their own way, but it does significantly increase efficiency, as analysts are no longer manually parsing individual data sources, particularly those selected based upon their own experience. Instead, the data sources are being parsed, and then enriched and decorated through an automated means, one that is continually improved upon. This would also reduce costs associated with commercial licenses, as teams would not have to purchase each analyst licenses for several products (i.e., "...I prefer this product to this work, and this other product for these other things...").

By approaching the initial phases of analysis in such a manner, efficiency is significantly increased, cost goes way down, and consistency goes through the roof. This can be especially true for organizations that encounter similar issues often. For example, internal organizations protecting corporate assets may regularly see certain issues across the infrastructure, such as malicious downloads or phishing with weaponized attachments. Similarly, consulting organizations may regularly see certain types of issues (i.e., ransomware, BEC, etc.) based on their business and customer base. Having an automated means for collecting, parsing, and enriching known data sources, and presenting them to the analyst saves time and money, gets the analyst to conducting analysis sooner, and provides for much more consistent and timely investigations.

Artifacts in Isolation

Deep within DFIR, behind the curtains and under the dust ruffle, when we see what really goes on, we often see analysts relying far too much on single sources of data or single artifacts for their analysis, in isolation from each other. This is very often the result of allowing analysts to "do their own thing", which while sounding like an authoritative way to conduct business, is highly inefficient and fraught with mistakes.

Not long ago, I heard a speaker at a presentation state that they'd based their determination of the "window of compromise" on a single data point, and one that had been misinterpreted. They'd stated that the ShimCache/AppCompatCache timestamp for a binary was the "time of execution", and extended the "window of compromise" in their report from a few weeks to four years, without taking time stomping into account. After the presentation was over, I had a chat with the speaker and walked through my reasoning. Unfortunately, the case they'd presented on had been completed (and adjudicated) two years prior to the presentation. For this case, the victim had been levied a fine based on the "window of compromise".

Very often, we'll see analysts referring to a single artifact (ShimCache entry, perhaps an entry in the AmCache.hve file, etc.) as definitive proof of execution. This is perhaps an understanding based on over-simplification of the nature of the artifact, and without corresponding artifacts from the constellation, will lead to inaccurate findings. It is often not until we peel back the layers of the analysis "onion" that it becomes evident that the finding, as well as the accumulated findings of the incident, were incorrectly based on individual artifacts, from data sources viewed in isolation from other pertinent data sources. Further, the nature of those artifacts being misinterpreted; rather than demonstrating program execution, they simply illustrate the existence of a file on the system.

Summary

Over the years that I've been doing DFIR work, little in the way of "analysis" has changed. We started out with getting a few hard drives that we imaged and analyzed, to going on-site to do collections of images, then to doing triage collections to scope the systems that needed to be analyzed. We then extended our reach further through the use of EDR telemetry, but analysis still came down to individual analysts applying just their own knowledge and experience to collected data sources. It's time we change this model, and leverage the capabilities we have on hand in order to provide more consistent, efficient, accurate, and timely analysis.

Testing, and taking DFIR a step further

$
0
0

One of Shakespeare's lines from Hamlet I remember from high school is, "...there are more things on heaven and earth, Horatio, than are dreamt of in your philosophy." And that's one of the great things about the #DFIR industry...there's always something new. I do not for a moment think that I've seen everything, and I, for one, find it fascinating when we find something that is either new, or that has been talked about but is being seen "in the wild" for the first time.

Someone mentioned recently that Microsoft's Antimalware Scan Interface (i.e., AMSI) could be used for persistence, and that got me very interested.  This isn't something specifically or explicitly covered by the MTRE ATT&CK framework, and I wanted to dig into this a bit more to understand it. As it can be used for persistence, it offers not only an opportunity for a detection, but also for a #DFIR detection and artifact constellation that can provide insight into threat actor sophistication and intent, as well as attribution. 

AMSI was introduced in 2015, and discussions of issues with it and bypassing it date back to 2016. However, the earliest discussion of the use of AMSI for persistence that I could find is from just last year. An interesting aspect of this means of persistence isn't so much as a detection itself, but rather how it's investigated. I've worked with analysis and response teams over the years, and one of the recurring questions I've had when something "bad" is detected is where that event occurred in relation to others. For example, whether you're using EDR telemetry or a timeline of system activity, all events tend to have one thing in common...a time stamp indicating the time at which they occurred. That is, either the event itself has an associated time stamp (file system time stamp, Registry key LastWrite time, PE file compile time, etc.), or some monitoring functionality is able to associate a time stamp with the observed event. As such, determining when a "bad" event occurred in relation to other events, such as a system reboot or a user login, can provide insight into determining if the event is the result of some persistence mechanism. This is necessary, as while EDR telemetry in particular can provide a great deal of insight, it is largely blind to a great deal of on-system artifacts (for example, Windows Event Log records). However, adding EDR telemetry to on-system artifact constellations significantly magnifies the value of both.

As I started researching this issue, the first resource to really jump out at me was this blog post from PenTestLab. It's thorough, and provides a good deal of insight as well as resources. For example, this post links to not only another blog post from b4rtik, but to a compiled DLL from netbiosX that you can download and use in testing. As a side note, be sure to install the Visual C++ redistributable on your system if you don't already have it, in order to get the DLL registration to work (Thanks to @netbiosX for the assist with that!)

I found that there are also other resources on the topic from Microsoft, as well.

Following the PenTestLab blog post, I registered the DLL, waited for a bit, and then collected a copy of the Software hive via the following command:

C:\Users\Public>reg save HKLM\Software software.sav

This testing provides the basis for developing #DFIR resources, including a RegRipper plugin. This allows detections to persist, particularly in larger environments, so that corporate knowledge is maintained.

It also sets the stage for further, additional testing. For example, you can install Sysmon, open a Powershell command prompt, submit the test phrase, and then create a timeline of system activity once calc.exe opens, to determine (or begin developing) the artifact constellation associated with this use of 

Speaking of PenTestLab, Sysmon, and taking things a step further, there's this blog post from PenTestLab on Threat Hunting AMSI Bypasses, including not just a Yara rule to run across memory, but also a Registry modification that indicates yet another AMSI bypass.

Toolmarks: LNK Files in the news again

$
0
0

 As most regular readers of this blog can tell you, I'm a bit of a fan of LNK files...a LNK-o-phile, if you will. I'm not only fascinated by the richness of the structure, but as I began writing a parser for LNK files, I began too see some interesting aspects of intelligence that can be gleaned from LNK files, in particular, those created within a threat actors development environment, and deployed to targets/infrastructures. First, there are different ways to create LNK files using the Windows API, and what's really cool is that each method has it's own unique #toolmarks associated with it!  

Second, most often there is a pretty good amount of metadata embedded in the LNK file structure. There are file system time stamps, and often we'll see a NetBIOS system name, a volume S/N, a SID, or other pieces of information that we can use in a VirusTotal retro-hunt in order to build out a significant history of other similar LNK files.

In the course of my research, I was able to create the smallest possible functioning LNK file, albeit with NO (yes, you read that right...) metadata. Well, that's not 100% true...there is metadata within the LNK file. Specifically, the Windows version identifier is still there, and this is something I purposely left. Instead of zero'ing it out, I altered it to an as-yet-unseen value (in this case, 0x0a). You can also alter each version identifier to their own value, rather than keeping them all the same.

Microsoft recently shared some information about NOBELIUM sending LNK files embedded within ISO files, as did the Volexity team. Both discuss aspects of the NOBELIUM campaign; in fact, they do so in a similar manner, but each with different details. For example, the Volexity team specifically states the following (with respect to the LNK file):

It should be noted that nearly all of the metadata from the LNK file has been removed. Typically, LNK files contain timestamps for creation, modification, and access, as well as information about the device on which they were created.

Now, that's pretty cool! As someone who's put considerable effort into understanding the structure of LNK files, and done research into creating the smallest, minimal, functioning LNK file, this was a pretty interesting statement to read, and I wanted to learn more.

Taking a look at the metadata for the reports.lnk file (from fig 4 in the Microsoft blog post, and fig 3 of the Volexity blog post) we see

guid               {00021401-0000-0000-c000-000000000046}
shitemidlist    My Computer/C:\/Windows/system32/rundll32.exe
**Shell Items Details (times in UTC)**
  C:0                   M:0                   A:0                  Windows  (9)
  C:0                   M:0                   A:0                  system32  (9)
  C:0                   M:0                   A:0                  rundll32.exe  (9)

commandline  Documents.dll,Open
iconfilename   %windir%/system32/shell32.dll
hotkey             0x0
showcmd        0x1

***LinkFlags***
HasLinkTargetIDList|IsUnicode|HasArguments|HasExpString|HasIconLocation

***PropertyStoreDataBlock***
GUID/ID pairs:
{46588ae2-4cbc-4338-bbfc-139326986dce}/4      SID: S-1-5-21-8417294525-741976727-420522995-1001

***EnvironmentVariableDataBlock***
EnvironmentVariableDataBlock: %windir%/system32/explorer.exe

***KnownFolderDataBlock***
GUID  : {1ac14e77-02e7-4e5d-b744-2eb1ae5198b7}
Folder: CSIDL_SYSTEM

While the file system time stamps embedded within the LNK file structure appear to have been zero'd out, a good deal of metadata still exists within the structure itself. For example, the Windows version information (i.e., "9") is still available, as are the contents of several ExtraData blocks. The SID listed in the PropertyStoreDataBlock can be used to search across repositories, looking for other LNK files that contain the same SID. Further, the fact that these blocks still exist in the structure gives us clues as to the process used to create the original LNK file, before the internal structure elements were manipulated.

I'm not sure that this is the first time this sort of thing has happened; after all, the MS blog post makes no mention of metadata being removed from the LNK file, so it's entirely possible that it's happened before but no one's thought that it was important enough to mention. However, items such as ExtraDataBlocks and which elements exist within the structure not only give us clues (toolmarks) as to how the file was created, but the fact that metadata elements were intentionally removed serve as additional toolmarks, and provide insight into the intentions of the actors.

But why use an ISO file? Well, interesting you should ask.  Matt Graeber said:

Adversaries choose ISO/IMG as a delivery vector b/c SmartScreen doesn't apply to non-NTFS volumes

In the ensuring thread, @arekfurt said:

Adversaries can also use the iso trick to put evade MOTW-based macro blocking with Office docs.

Ah, interesting points! The ISO file is downloaded from the Internet, and as such, would likely have a zone identifier ADS associated with it (I say, "likely" because I haven't seen it mentioned as a toolmark), whereas once the ISO file is mounted, the embedded files would not have zone ID ADSs associated with them. So, the decision to use an ISO file was intentional, and not just cool...in fact, it appears to have been intentionally used for defense evasion.


Thoughts on Assessing Threat Actor Intent & Sophistication

$
0
0

I was reading this Splunk blog post recently, and I have to say up front, I was disappointed by the fact that the promise of the title (i.e., "Detecting Cl0p Ransomware") was not delivered on by the remaining content of the post. Very early on in the blog post is the statement:

Ransomware is by nature a post-exploitation tool, so before deploying it they must infiltrate the victim's infrastructure. 

Okay, so at this point, I'm looking for something juicy, some information regarding the TTPs used to "infiltrate the victim's infrastructure" and to locate files of interest for staging and exfil, but instead, the author(s) dove right into analyzing the malware itself, through reverse engineering. Early in that malware RE exercise is the statement:

This ransomware has a defense evasion feature where it tries to delete all the logs in the infected machine to avoid detection.

The embedded command is essentially a "one-liner" used to list and clear all Windows Event Logs, leveraging wevtutil.exe. However, while used for "defense evasion", it occurred to me that this command is not, in fact, intended to "avoid detection".  After all, with ransomware, the threat actors want to get paid, so they want to be detected. In fact, to ensure they're detected, the actors put ransom notes on the system, with clear statements, declarations, warnings, and time limits. In this case, the ransom note says that if action is not taken in two weeks, the files will be deleted. So, yes, it's safe to say that clearing all of the Windows Event Logs is not about avoiding detection. If anything, its really nothing more than a gesture of dominance, the threat actor saying, look at what I can do to your system. 

So, what is the purpose of clearing the Windows Event Logs? As a long-time #DFIR analyst, the value of the Windows Event Logs in such cases is to assist in a root-cause analysis (RCA) investigation, and clearing some Windows Event Logs (albeit not ALL of them) will hobble (but not completely remove) a responder's ability to determine aspects of the attack cycle such as lateral movement. By tracing lateral movement, the investigator can determine the original system used by the threat actor to gain access to the infrastructure, the "nexus" or "foothold" system, and from there, determine how the threat actor gained access. I say "hobble" because clearing the Windows Event Logs does not obviate the ability of the investigator to recover the event records, it simply requires a bit more effort. However, the vast majority of organizations impacted by ransomware are not conducting full investigations or RCAs, and #DFIR consulting firms are not publicly sharing ransomware trends and TTPs, anonymized through aggregation. In short, clearing the Windows Event Logs, or not, would likely have little impact either way on the response.

But why clear ALL Windows Event Logs? IMHO, it was used to ensure that the ransomware attack was, in fact, detected. Perhaps the assumption is that most organizations have some small modicum of a detection capability, and the most rudimentary SIEM or EDR framework should throw an alert of some kind in the face of the "wevtutil cl" command, or when the SIEM starts receiving events indicating that Windows Event Logs were cleared (especially if the Security Event Log was cleared!).

What We Know About The Ransomware Economy

$
0
0

Okay, I think that we can all admit that ransomware has consumed the news cycle of late, thanks to high visibility attacks such as Colonial Pipeline and JBS. Interestingly enough, there wasn't this sort of reaction the second time the City of Baltimore got attacked, which (IMHO) belies the news cycle more than anything else.

However, while the focus is on ransomware, for the moment, it's a good time to point out that there's more to this than just the attacks that get blasted across news feeds. That is, ransomware itself is an economy, an eco-system, which is a moniker that goes a long way to toward describing why victims of these attacks are impacted to the extent that they are. What I mean by this is that everything...EVERYTHING...about what goes into a ransomware attack is directed at the final goal of the threat actor...someone...getting paid. What goes further to making this an eco-system is that when a ransomware attack does result in the threat actor getting paid, there are also others in the supply chain (see what I did there??) who are also getting paid.

I was reading Unit42's write-up on the Prometheus ransomware recently, and I have to say, a couple of things really stood out for me, one being the possible identification of a "false flag". The Prometheus group apparently made a claim that is unsupported by the data Unit42 has observed. Even keeping collection bias in mind, this is still very interesting. What would be the purpose of such a "false flag"? Does it tell use that the Prometheus group has insight into the workings of most counter threat intel (CTI) functions; have they "seen" CTI write-ups and developed their own version of the MITRE ATT&CK matrix?

Regardless of the reason or rationale behind the statement, Unit42 is...wait for it...relying on their data.  Imagine that!

Another thing that stood out is the situational awareness of the ransomware developer.

When Prometheus ransomware is executed, it tries to kill several backups and security software-related processes, such as Raccine...

Well, per the article, this is part of the ransomware itself, and not something the threat actors appear to be doing themselves. Being part of more than a few ransomware investigations over the years, relying on both EDR telemetry and #DFIR data, I've seen different levels of situational awareness on the part of threat actors. In some cases where the EDR tool blocks a threat actor's commands, I've seen them either give up, or disable or remove AV tools. In some cases, the threat actor has removed AV tools prior to performing a query, so the question becomes, was that tool even installed on the system?

This does, however, speak to how the barrier for entry has been lowered; that is, a far less sophisticated actor is able to be just as effective, or more so. Rather than having to know and manage all the parts of the "business", rather than having to invest in the resources required to gain access, navigate the compromised infrastructure, and then develop and deploy ransomware...you can just buy those things that you need. Just like the supply chain of a 'normal' business. Say that you want to start a business that's going to provide products to people...are you going to build your own shipping fleet, or are you going to use a commercial shipper (DHL, FedEx, UPS, etc.)?

Further, from the article:

At the time of writing, we don’t have information on how Prometheus ransomware is being delivered, but threat actors are known for buying access to certain networks, brute-forcing credentials or spear phishing for initial access.

This is not unusual. This write-up appears to be based primarily on OSINT, and does not seem to be derived from actual intrusion data or intelligence. The commands listed in the article for disabling Raccine are reportedly embedded in the ransomware executable itself, and not something derived from EDR telemetry, nor DFIR analysis. So what this is saying is that threat actors generally gain access by brute-forcing credentials (or purchasing them), or spear phishing, or by purchasing access from someone who's done either of the first two.

Again, this speaks to how the barrier for entry has been lowered.  Why put the effort into gaining access yourself when you can just purchase access someone else has already established?  

We’ve compiled this report to shed light into the threat posed by the emergence of new ransomware gangs like Prometheus, which are able to quickly scale up new operations by embracing the ransomware-as-a-service (RaaS) model, in which they procure ransomware code, infrastructure and access to compromised networks from outside providers. The RaaS model has lowered the barrier to entry for ransomware gangs.

Purchasing access to compromised computer systems...or compromising computer systems for the purpose of monetizing that access...is nothing new. Let's look back 15+ years to when Brian Krebs interviewed a botherder known as "0x80". This was an in-person interview with a purveyor of access to compromised systems, which is just part of the eco-system. Since then, the whole thing has clearly been "improved upon".

This just affirms that, like many businesses, the ransomware economy, the eco-system, has a supply chain. This not only means that there are specializations within that supply chain, and that the barrier to entry is lowered, it also means that attribution of these cybercrimes is going to become much more difficult, and possibly tenuous, at best.

Tips for DFIR Analysts

$
0
0

Over the years as a DFIR analyst...first doing digital forensics analysis, and then incorporating that analysis as a component of IR activity...there have been some stunningly simple truths that I've learned, truths that I thought I'd share. Many of these "tips" are truisms that I've seen time and time again, and recognized that they made much more sense and had more value when they were "named".

Tips, Thought, and Stuff to Think About

Computer systems are a finite, deterministic space. The adversary can only go so far, within memory or on the hard drive. When monitoring computer systems and writing detections, the goal is not write the perfect detection, but rather to force the adversary into a corner, so that no matter what they do, they will trigger something. So, it's a good thing to have a catalog of detections, particularly if it is based on things like, "...we don't do this here..".

For example, I worked with a customer who'd been breached by an "APT" the previous year. During the analysis of that breach, they saw that the threat actor had used net.exe to create user accounts within their environment, and this is something that they knew that they did NOT do. There were specific employees who managed user accounts, and they used a very specific third-party tool to do so. When they rolled out an EDR framework, they wrote a number of detection rules related to user account management via net.exe. I was asked to come on-site to assist them when the threat actor returned; this time, they almost immediately detected the presence of the threat actor. Another good example is, how many of us log into our computer systems and type, "whoami" at a command prompt? I haven't seen many users do this, but I've seen threat actors do this. A lot.

From McChrystal's "Team of Teams", there's a difference between "complexity" and "complicated". We often refer to computer systems and networks as "complex", when they are really just complicated, and inherently knowable. We, as humans, tend to make things that are complicated out to be complex.

A follow-on to the previous tip is that there is an over-use of the term "sophisticated" to describe a significant number of attacks. When you look at the data, very often you'll see that attacks are only as sophisticated as they need to be, and in most cases, they really aren't all that sophisticated. An RDP server with an account password of "password" (I've seen this recently...yes, during the summer of 2021), or a long-patched vulnerability with a freely available published exploit (i.e., JexBoss was used by the Samas ransomware actors during the first half of 2016).

When performing DF analysis, the goal is to be as comprehensive and thorough as possible. A great way to achieve this is through automation. For example, I developed RegRipper because I found that I was doing the same things over and over again, and I wanted a way to make my job easier. The RegRipper framework allowed me to add checks and queries without having to write (or rewrite) entirely new tools every time, as well as provided a framework for easy sharing between analysts.

TCP networking is a three-stage handshake, UDP is "fire and forget". This one tip helped me a great deal during my early days of DFIR consulting, particularly when having discussions with admins regarding things like firewalls and switches.

Guessing is lazy. Recognize when you're doing it before someone else does. If there is a gap in data or logs, say so. At some point, someone is going to see your notes or report, and see beyond the veil of emphatic statements, and realize that there are gaping holes in analysis that were spackled over with a thin layer of assumption and guesswork. As such, if you don't have a data source...if firewall logs were not available, or Windows Event Logs were disabled, say so.

The corollary to the tip on "guessing" is that nothing works better than a demonstration. Years ago, I was doing an assessment of a law enforcement headquarters office, and I was getting ready to collect password hashes from the domain server using l0phtcrack. The admin said that the systems were locked down and there was no way I was going to get the password hashes. I pressed the Enter key down, and had the hashes almost before the Enter key returned to its original position. The point is, rather than saying that a threat actor could have done something, a demonstration can drive the point home much quicker.

Never guess at the intentions of a threat actor. Someone raised in the American public school system, with or without military or law enforcement experience, is never going to be able determine the mindset of someone who grew up in the cities of Russia, China, etc. That is, not without considerable training and experience, which many of us simply do not have. It's easy to recognize when someone's guessing the threat actor's intention, because they'll start off a statement with, "...if I were the threat actor...".

If no one is watching, there is no need for stealth. The lack of stealth does not bely sophistication. I was in a room with other analysts discussing the breach with the customer when one analyst described what we'd determined through forensic analysis as, "...not terribly sophisticated...", in part because the activity wasn't very well hidden, nor did the attacker cover their tracks. I had to later remind the analyst that we had been called in a full 8 months after the threat actor's most recent activity.

The adversary has their own version of David Bianco's "Pyramid of Pain", and they're much better at using it. David's pyramid provides a framework for understanding what we (the good guys) can do to impact and "bring pain" to the threat actor. It's clear from engaging in hundreds of breaches, either directly or indirectly, that the bad guys have a similar pyramid of their own, and that they're much better at using theirs.

We're not always right, or correct. It's just a simple fact. This is also true of "big names", ones we imagine are backed by significant resources (spell checkers, copy editors, etc.), and as such, we assume are correct and accurate. As such, we shouldn't blindly accept what others say in open reporting, not without checking and critical thinking.

There are a lot of assumptions in this industry. I'm sure it's the same in other industries, but I can't speak to those industries. I've seen more than a few assumptions regarding royalties for published books; new authors stating out big publishers may start out at 8%, or less. And that's just for paper copies (not electronic), and only for English language editions. I had a discussion once with a big name in the DFIR community who assumed that because I worked for a big name company, of course I had access to commercial forensic suites; they'd assumed that my commenting on not having access to such suites was a load of crap. When I asked what made them think that I would have access to these expensive tool sets, they ultimately said that yes, they'd assumed that I would.

If you're new to DFIR, or if you've been around for a while, you've probably found interviewing for a job to be nerve-racking, anxiety-producing affairs. One thing to keep in mind is that most of the folks you're interviewing with aren't terribly good at it, and are probably just as nervous as you. Think about it...how many times have you seen courses offered in how to conduct a job interview, from the perspective of the interviewer?

Building a Career in CyberSecurity

$
0
0

There's been a lot of discussion on social media around how to "break into" the cybersecurity field, not only for folks just starting out but also for those looking for a career change. This is not unusual, given what we've seen in the public news media around cyber attacks and ransomware; the idea is that cybersecurity is an exploding career field that is completely "green fields", with an incredible amount of opportunity.

Jax Scott recently shared a YouTube video (be sure to comment and subscribe!) where she provides five steps to level up any career, based on her "must read for anyone seeking a career in cybersecurity" blog post. Jax makes a lot of great points, and rather than running through each one and giving my perspective, I thought I'd elaborate a bit on one in particular.

Jax's first tip is to network. This is profound...really profound...for a number of reasons.

First, what I see a LOT of is folks on social media asking for advice on getting into the cybersecurity field, without realizing that the "cybersecurity field" is a huge, expansive...there are a lot of different things you can do in the field. Networking lets you see what you may not see, and it affords you the opportunity to see different aspects of the field. For example, there are more technical (pen testing, digital forensics) aspects of "cybersecurity", as well as less technical (incident management, compliance, policies, etc.) aspects. Not everyone is suited to everything in this field...I once worked with/mentored an incident response consultant who got so anxious when it was their turn to go on-site that they once had to check themselves into the hospital, and another analyst had to take the engagement.

Second, when you do network, make sure that it's purposeful and intentional. Clicking "like" or "follow", or just sending someone a blind connection request on LinkedIn, isn't really "networking", because it's too passive. If you're networking to develop an understanding of the field, and to find a (new) job, just following or connecting to someone isn't going to get you there.

Networking with intent affords us something else, as well. In his book, "Call Sign Chaos", retired Marine general Jim Mattis stated that "...your personal experiences alone aren't broad enough to sustain you." This is just as true in the cybersecurity field as it is to the warfighter, and intentional networking allows us to broaden our experiences through purposeful engagement with others.

I see recommendations on LinkedIn all the time with tips for how to develop your "brand", and most include things such as leaving a comment rather than liking a post, referring to/referencing other posts, as well as other activities that are active, rather than passive. All of these amount to the same thing...purposeful, intentional networking.

Be sure to check out and subscribe to Jax's YouTube videos for a lot of great insight and information, as well as follow the "Hackerz and Haecksen" podcast for some insightful interviews and content!

On Writing DFIR Books, pt I

$
0
0

During my time in the industry, I've authored 9 books under three imprints, and co-authored a tenth.

There, I said it. The first step in addressing a problem is admitting you have one. ;-)

Seriously, though, this is simply to say that I have some experience, nothing more. During the latter part of my book writing experience, I saw others who wanted to do the same thing, but ran into a variety of roadblocks, roadblocks I'd long since navigated. As a result, I tried to work with the publisher to create a non-paid liaison role that would help new authors overcome many of those issues, so that a greater portfolio of quality books became available to the industry. By the time I convinced one editor of the viability and benefit of such a program, they had decided to leave their profession, and I had to start all over again, quite literally from the very beginning.

Authoring a book has an interesting effect, in that it tends to create a myth around the author, one that they're not aware of at first. It starts with someone saying, "...you wrote a book, so you must X..". Let "X" be just about anything. 

"Of course you're good at spelling, you wrote a book." Myth.

"You must be rolling in money, you wrote a book." Myth.

All of these things are assumptions, myths built up only to serve as obstacles. The simple fact is that if you feel like you want to write a book, you can. There's nothing stopping you, except...well...you. To that end, I thought I'd write a series of posts that dispel the myths and provide background and a foundation for those considering the possibility of writing a book.

There are a number of different routes to writing books. Richard Bejtlich has authored or co-authored a number of books, the most recent of which have been reprints of his Tao Security blog posts. Emma Bostian tweeted about her success with "side projects", the majority of which consisted of authoring and marketing her ebooks.

The Why
So, why write books at all? In an email that Gen Jim Mattis (ret) authored that later went viral, he stated:

By reading, you learn through others’ experiences, generally a better way to do business, especially in our line of work where the consequences of incompetence are so final for young men.

Yes, Gen Mattis was referring to warfighting, but the principle equally well for DFIR work. In his book, "Call Sign Chaos", Mattis further stated:

...your personal experiences alone aren't broad enough to sustain you.

This is equally true in DFIR work; after all, what is "analysis" but the analyst applying the sum total of their knowledge and experience to the amassed data? As such, the reason to write books is that no one of us knows everything, and we all have vastly different experiences. Even working with another analyst on the same incident response engagement, I've found that we've had different experiences due in large part to our different perspectives.

The simple fact is that these different perspectives and experiences can be profoundly valuable, but only if they're shared. A while back, I engaged in an analysis exercise where I downloaded an image and memory sample provided online, and conducted analysis based on a set of goals I'd defined. During this exercise, I extracted significantly different information from the memory sample using two different tools; I used Volatility to extract information about netstat-style network connections, and I also used bulk_extractor to retrieve a PCAP file, built from the remnants of actual packets extracted from memory. I shared what I'd done and found with one other analyst, and to be honest, I don't know if they ever had the chance to try it, or remembered to do so the next time the opportunity arose. Since then, I have encountered more than a few analysts to whom this approach never occurred, and while they haven't always seen significant value from the effort, it remains a part of their toolkit. I also included the approach in "Investigating Windows Systems", where it is available, and I assume more than one analyst has read it and taken note.

Speaking for myself, I began writing books because I couldn't find what I wanted on the shelves of the bookstore. It's as simple as that. I'd see a title with the words "Windows" and "forensics" in the title, and I'd open it, only to find that the dive did not go deep enough for me. At the time, many of the books related to Windows forensics were written by those who'd "grown up" using Linux, and this was clearly borne out in the approach taken, as well as the coverage, in the books.

The First Step
The first step to successfully writing a book is to read. That's right...read. By reading, we get to experience a greater range of authorship, see and decide what we enjoy reading (and what we pass on), and then perhaps use that in our own writing.

My first book was "Windows Forensics and Incident Recovery", published in 2004. The format and structure of chapter 6 of that book is based on a book I read while I was on active duty in the military titled "The Defense of Duffer's Drift". I liked the way that the author presented the material so much that I thought it would be a useful model for sharing my own story. As it turned out, that was the one chapter that my soon-to-be wife actually read completely, as it is the only chapter that isn't completely "technical".

With that, thoughts, comments and questions are, as always, welcome. Keep an eye open for more to come!


Viewing all 505 articles
Browse latest View live